Clipping

What if you could identify the applause in every recording in the PennSound archive? With that information, you might ask who receives the most applause, which poems by a given author are most likely to spur an audience response, and which venues lend themselves to the warmest reception. In the following we present our initial work toward using machine learning to answer just such questions.
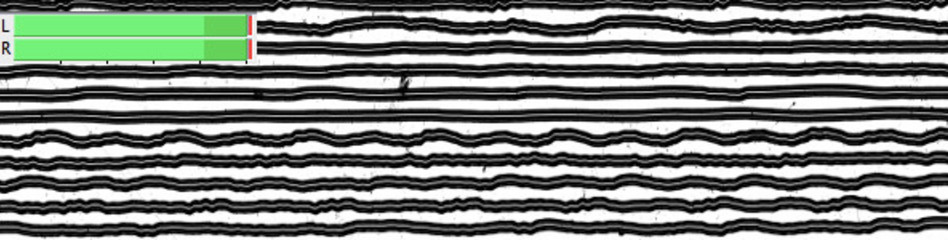
Using the ARLO audio analysis tool, developed as part of the HiPSTAS (High Performance Sound Technologies for Access and Scholarship) project, we collected several hundred clips of applause and non-applause from the PennSound poetry archive to train a machine learning algorithm that identifies similar patterns in unseen segments. An example of applause from a 2001 reading by Bhanu Kapil at the University of Hawaii at Manoa can be viewed in this video, with the annotated or “tagged” portion displayed in the image below.
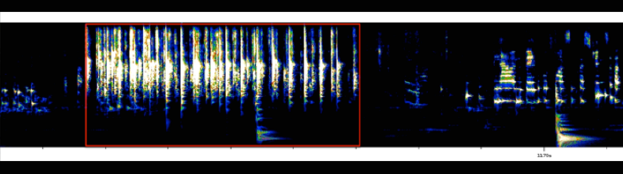
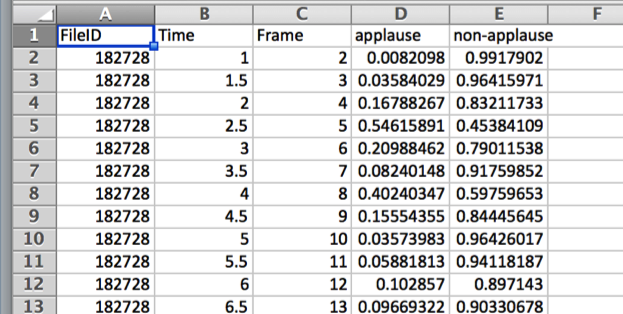
In May 2015 we ingested PennSound’s over 36,000 files (6,200 hours) into ARLO. We chose 2,000 files at random to create a set of 274 three-second clips of applause and 582 three-second examples of non-applause. To increase accuracy, we divided the three-second segments into smaller, half-second clips. ARLO used these data to train an instance-based classification model: that is, ARLO creates a spectral profile — a matrix of numbers representing energy levels at various pitch values — for an unlabeled audio segment and compares it to each labeled clip (applause and non-applause) in the training set. The results include a probability for each previously unlabeled clip on whether or not it is an instance of applause.
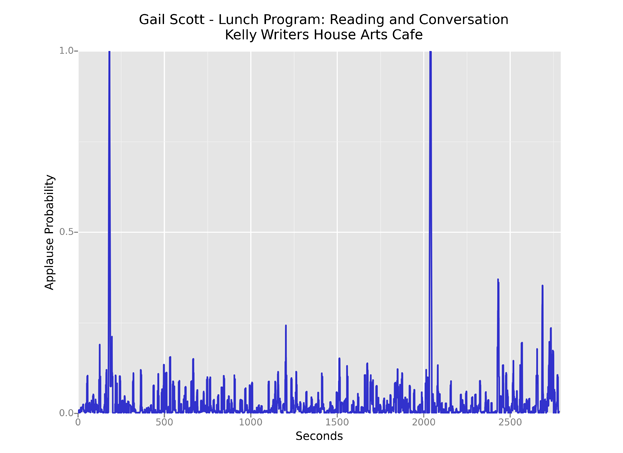
By graphing the resulting probabilities over time, we can see passages of applause as distinct spikes over the course of a reading. As a first step in testing our model, we had it evaluate each of the 2,000 files in our training set. We created plots of the results and visually inspected each one, informally checking our work and taking note of general patterns. Once satisfied that our output made sense, we ran the model on the rest of PennSound and created a plot for each file. In this graph, as in all that follow, small-scale fluctuations are smoothed from our data using a rolling average over a five-second window.
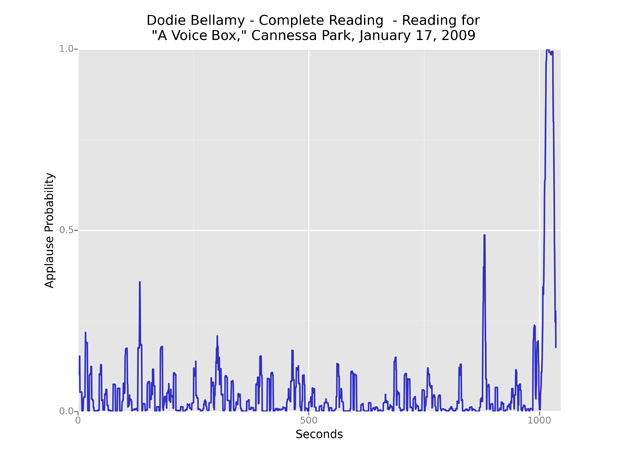
Most visualizations look something like the example above, with a distinct period of applause falling at the end of a performance. Many also include applause near the beginning, typically marking the end of a brief introduction. We can thus make general inferences about the structure of a reading by looking at its applause distribution. In the following example, a spike at about four minutes marks the transition from Thom Donovan’s introduction to Alan Bernheimer’s performance.
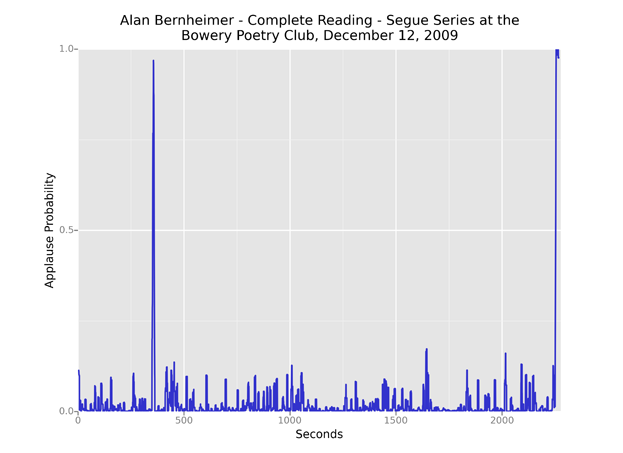
This pattern is fairly consistent for the Segue Reading Series: an introduction of roughly five minutes followed by a performance, with the full recording lasting 30–40 minutes. Some readers, of course, receive additional applause breaks.
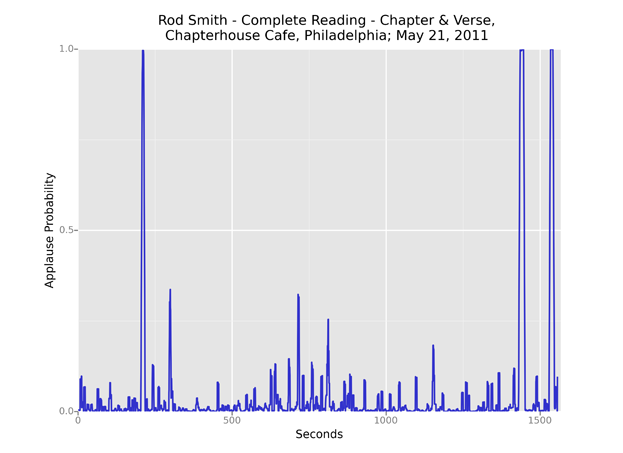
A feature commonly visible in these plots is a “housekeeping” segment at the end of a recording. In the track below, Rod Smith’s performance ends with 18 seconds of applause, followed by an announcement of books for sale and details on the next reading in the series, then another, shorter round of applause.
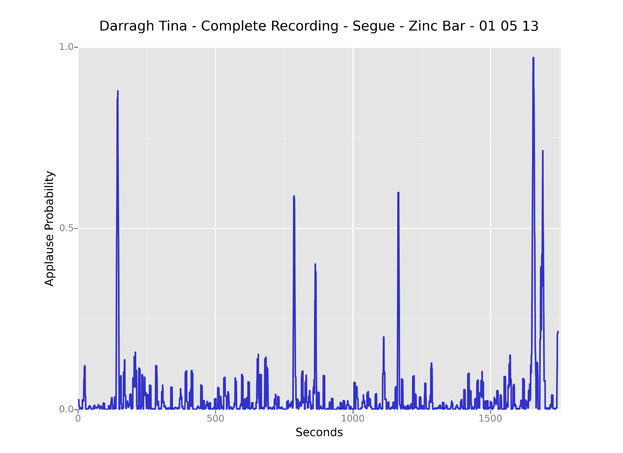
An applause spike around two-thirds or three-quarters of the way through a recording often indicates the beginning of a Q&A session, as in the following example.
For longer recordings comprising multiple performances, applause often serves as a handy boundary marker. In this plot, spikes fall between readings by Andrew Rippeon, Chris Sylvester, Divya Victor, and Steven Zultanski, as well as introductions by Sarah Dowling and Jessica Lowenthal and a discussion period at the end.
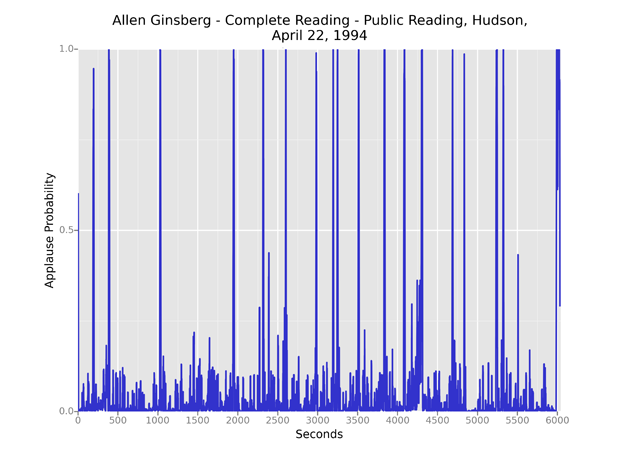
Naturally, some audiences are more inclined to applaud and some performers are more successful at drawing sustained or repeated reactions. Below, a late-career Allen Ginsberg receives applause 18 times over 100 minutes.
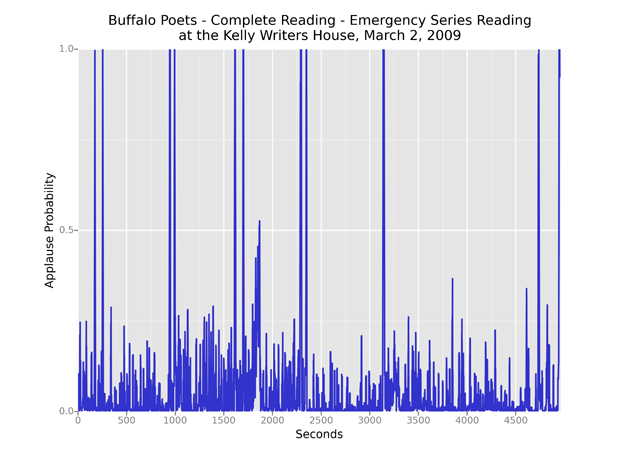
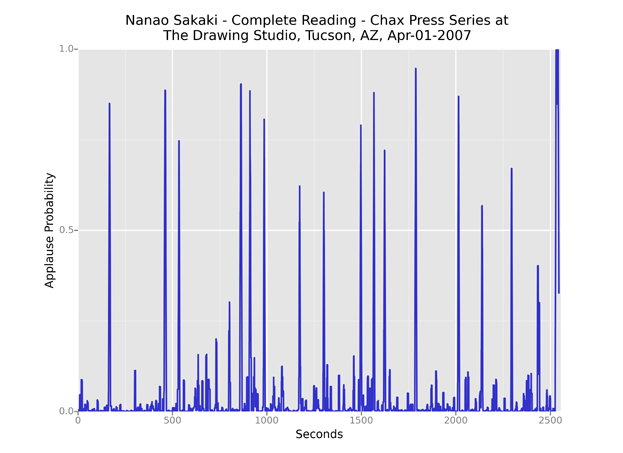
Another outlier is Nanao Sakaki’s 2007 reading in Tucson, which includes over a dozen applause breaks in 42 minutes. These breaks tend to be brief compared to those in the Ginsberg recording above, leading their corresponding spikes to appear shortened as a result of the rolling average we applied.
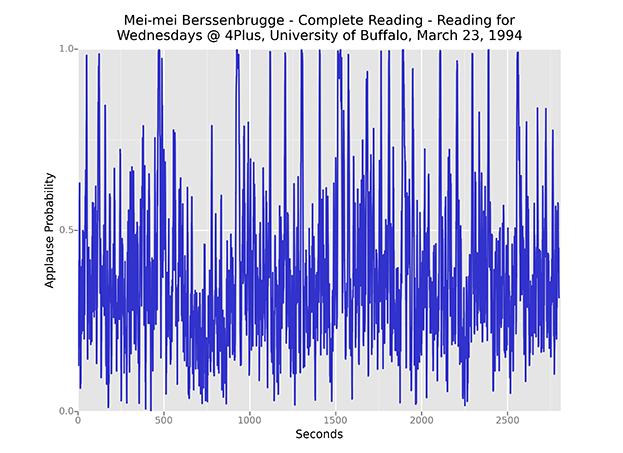
Though ARLO's classification accuracy exceeded 99% in one recent test, that still leaves plenty of room for false positives when considering thousands of hours of audio. Extremely hiss-laden recordings, like this 1994 reading by Mei-mei Berssenbrugge, can throw off the algorithm completely.
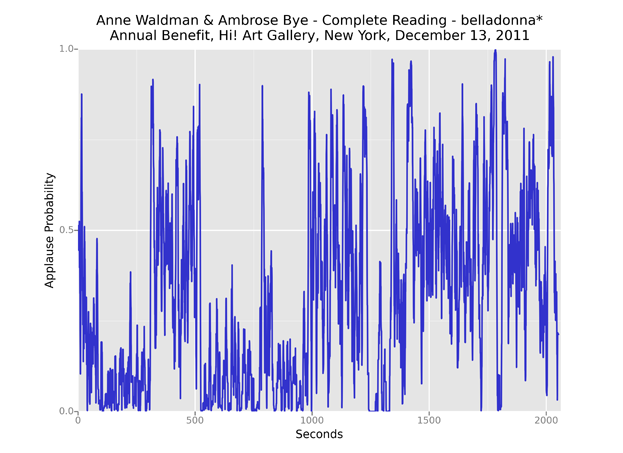
Musical accompaniment sometimes causes problems as well, as in this collaboration between Anne Waldman and her son, guitarist Ambrose Bye.
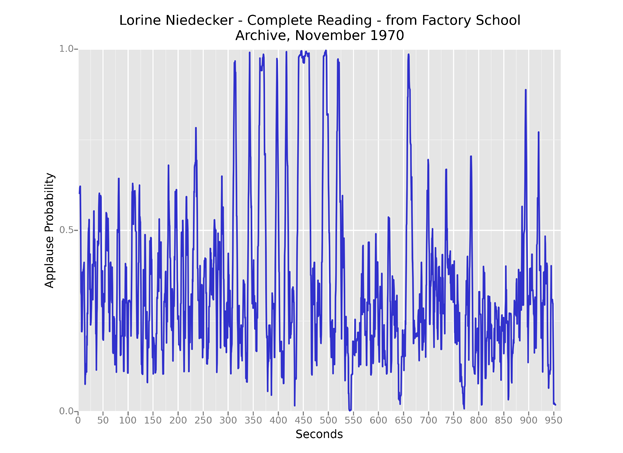
And in this 1970 recording of Lorine Niedecker, the poet's extended page shuffling between poems consistently registered as applause, producing tall spikes throughout the graph.
Why is this kind of machine learning model of interest, even given its mistakes? Though it takes patience to produce usable results, detecting applause on an archive-wide scale allows us to ask new questions that are relevant to the history and continued practice of performed poetry. By referencing the metadata embedded in PennSound, we can begin to broadly consider the relationship between poets and their audiences. Do poets in general receive more applause as they get older? Or just the really famous ones? Are there differences in reception based on perceived identity factors? Are applause patterns identifiably different between regions, venues, and reading series? Was there more applause in the ’80s? The ’90s? Now? Can the presence of applause help us pinpoint information that is not included in the metadata? Can we read meaning into the varying durations of Q&A sessions and introductions?
We see this initial interpretation of our PennSound applause data as more of a provocation than a proof of concept. As this project advances, future work will include a detailed evaluation of ARLO’s classification performance, experimentation with alternative visualizations, statistical exploration using the entire audio archive, and, ultimately, new critical readings based on the data outlined here.